We’ve had a busy few weeks since the June redesign. A lot of this came directly from things you’ve asked for: stateful apps, better logs, and a dashboard that doesn’t assume everyone speaks English.
Here’s what shipped.
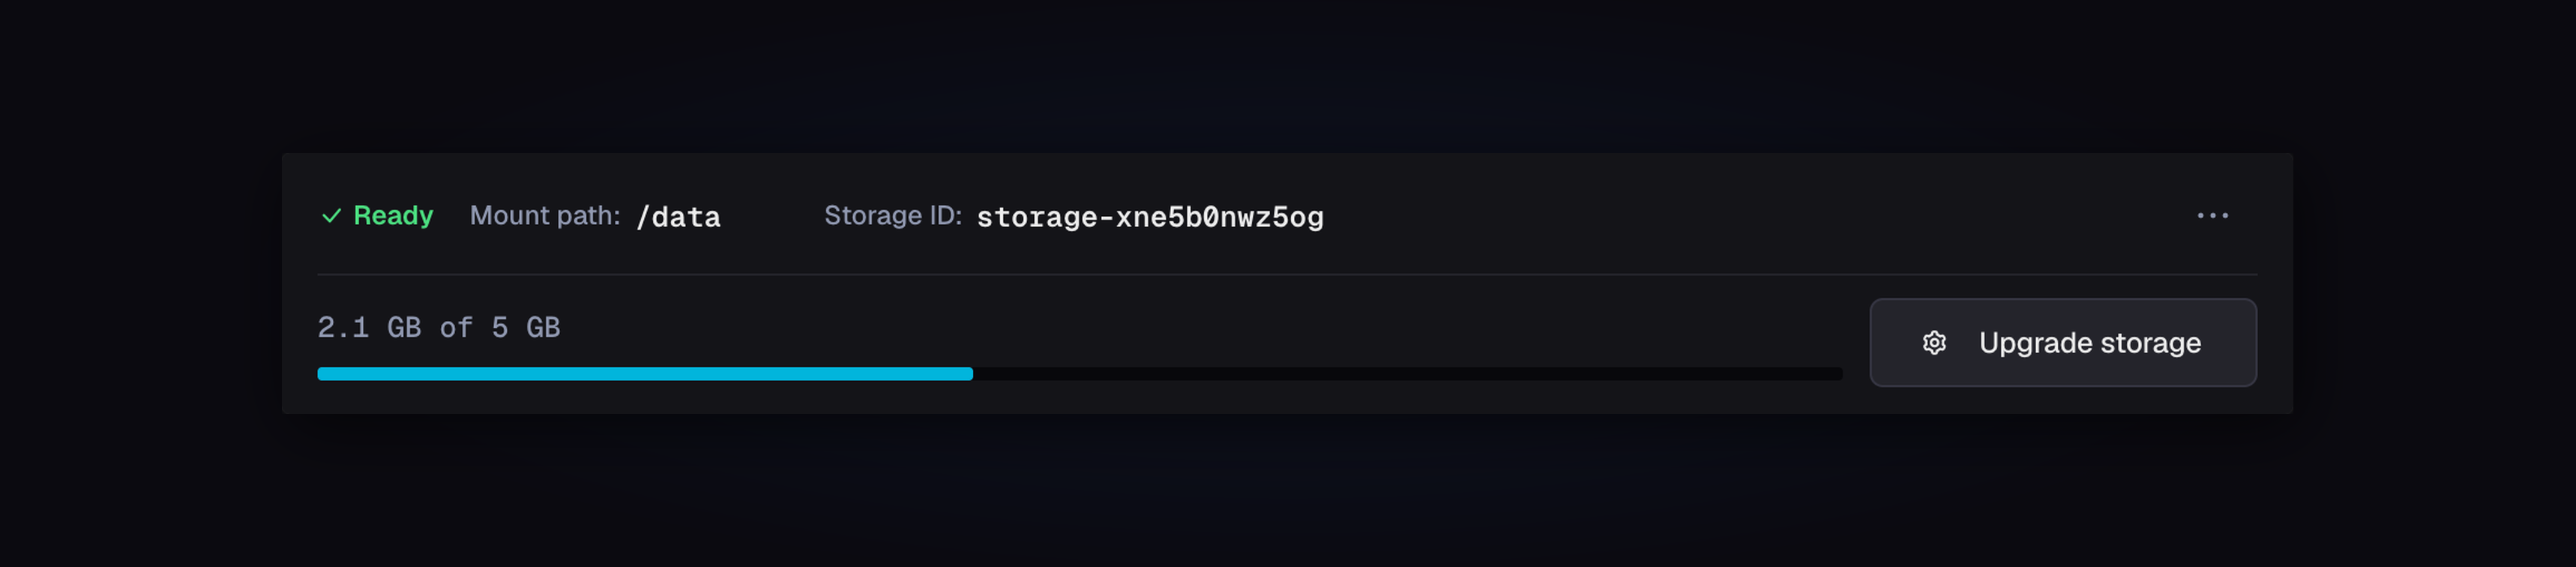
Persistent Storage (Beta)
This is the big one. You can now attach persistent block storage to your
application services, including web and worker apps, so files under a mount path
(say /data or /uploads) survive redeploys and restarts.
Open any application, go to the new Storage tab, and you can add, upgrade, or remove a volume. Sizes run from 5 GB to 100 GB at $0.50/GB/month.
You pick the mount path, we attach the volume, and anything written under that path sticks around. You’ll see usage when metrics are available, and storage costs show up in your team’s Spending details like any other resource.
If your balance is low when you’re adding storage, you can top up and provision in one flow.
We’re marking this Beta because it’s new infrastructure, and we want to be upfront about how it works today:
- Persistent storage requires exactly 1 replica. You can’t scale to multiple replicas while a volume is attached
- You get one volume per service, and it’s not shared with other services
- You can’t add storage to a suspended service
- Size can only go up, never down
- Creating or resizing a volume causes brief downtime while we provision it
- Deleting storage is permanent. All data on the volume is gone
If you’re running something that writes to disk (uploads, SQLite, local cache, session files), this should finally make seenode feel like a proper place to host it.
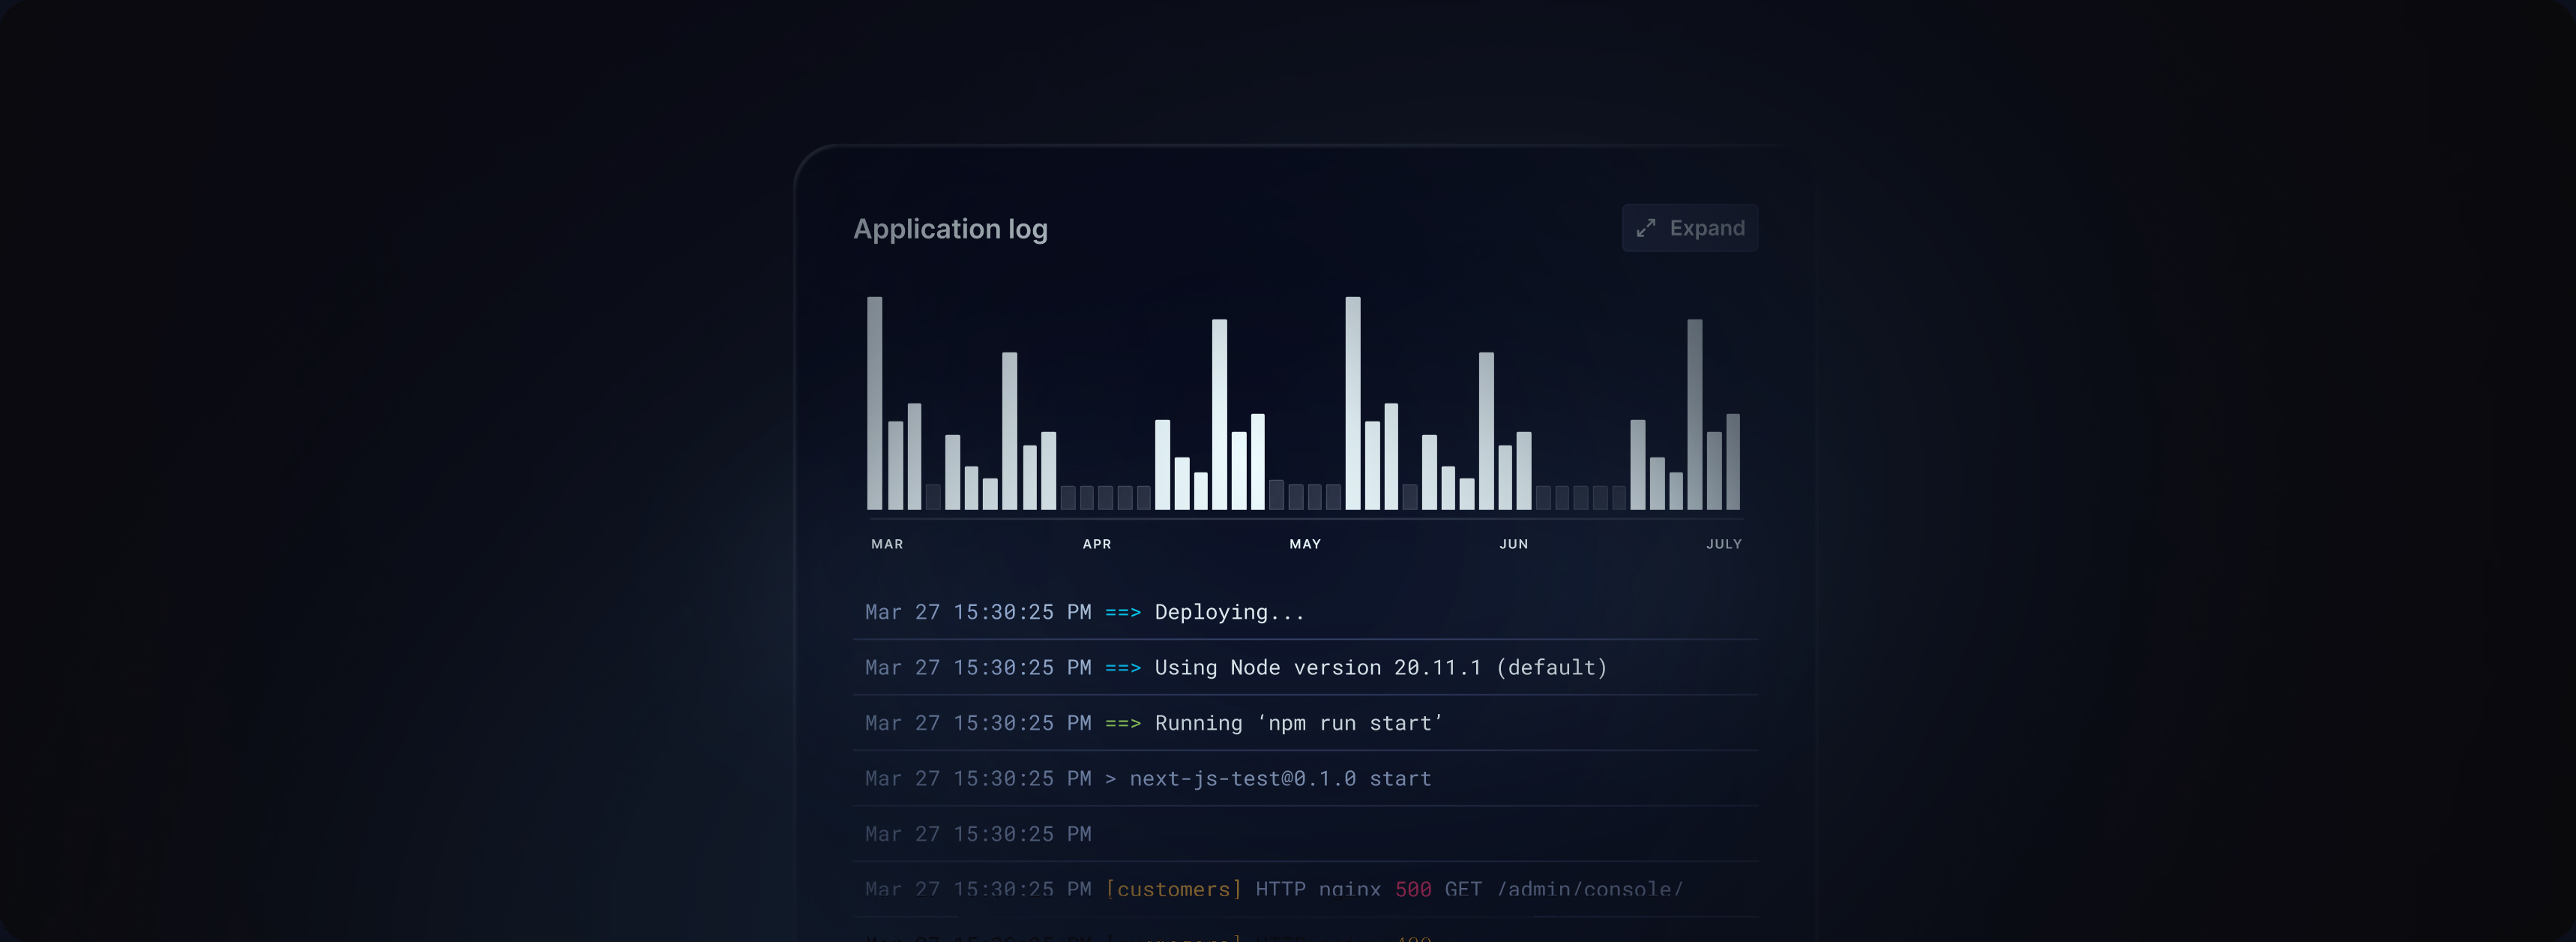
Historical logs, histogram and calendar picker
Logs got a proper overhaul. Until now, you were mostly stuck with live tail. That’s fine when you’re watching a deploy, but useless when you’re trying to figure out what broke at 3 AM yesterday.
You can now browse 7 days of history. There’s a histogram at the top showing log volume over time. Click a bar and you jump straight to that window.
Filter by Runtime, Build, or Request logs. Live tail is still there when you need it, and you can load older entries as you scroll.
We also added a calendar picker so you’re not limited to presets. Pick any range within those 7 days, or use the quick shortcuts: Live tail, Last 1/3/7 days.
The sidebar is resizable too, so you can give yourself more room when you’re deep in a debugging session.

Multi-language dashboard
The dashboard is now available in English, German, Spanish, French, Polish, and Portuguese.
You can switch language on the fly without reloading the page: sidebar, dialogs, toasts, the core flows.
Billing and upgrade improvements
We’ve been tightening up the billing flows you hit when upgrading a service or topping up credits.
Upgrade dialogs now show daily prices alongside the monthly estimate, so the math is easier to reason about. There’s a $10 quick-select chip on the top-up picker, and the auto top-up toggle is visible right inside the upgrade dialog instead of buried elsewhere.
The minimum checkout amount is $10, enforced on our side.
If you’ve tried topping up on mobile, that should work properly now. We fixed a redirect issue where the Stripe checkout would open in a popup that mobile browsers blocked.
Small but worth mentioning: database tier storage in the upgrade dialog was showing MB when it should have been GB. That’s corrected.
Fixes
Billing
- Bonus credits on top-up are now calculated on the pre-tax amount. If you’re in a region where tax applies to checkout, you were previously getting slightly more bonus credit than intended
- Manual top-ups through Stripe checkout could occasionally fail to credit your account because the invoice wasn’t ready yet when our webhook fired. Credits should land reliably now
Logs
- Windows browser issues sorted out
- Filter inputs now fill the sidebar width on smaller layouts
- Histogram bar alignment corrected